
How to tune Spark Shuffle Partitions.
So, you’re just a regular old Data Engineer crawling along through the data muck, barley keeping your head above the bits and bytes threatening to drown you. At point in time you were full of spit and vinegar and enjoyed understanding and playing with every nuance known to man.
But, not you are old and wizened, exhausted with the never ending stream of JIRA tickets from which you can never get ahead. You write lots of Spark jobs, consider yourself a PySpark pipeline writing expert … but when it comes to Spark performance tuning and optimizations? That’s for the birds.
Well my friend, don’t let all the Scala experts look down on you, scare you into thinking Spark performance is simply to complex for the common developer. Liars, every last mother one of them.
Sure, there are probably some jobs crunching Petabytes of data daily, and those might require Spark savants to tickle and smooth Spark into the most smooth and streamlined codebase that screams with performance. That is not very many of us. There are a few basic Spark tuning concepts that we can at least wrap our little grimy fingers around and show our mothers proudly.
Enter Spark DataFrame Partitions.
Let’s get out the chalk board, and later break out some PySpark code itself, and understand …
- what DataFrame partitions are
- how the affect performance
- and how we can tweak them to our advantage
When Spark, a distributed processing engine, reads data … it must represent AND process that data in chunks of memory. Clearly, many Spark datasets cannot be shoved into memory entirely, they are simply too big, and a single machine with that much RAM either doesn’t exist or costs your firstborn to run.
Aka, the dataset is large then available RAM, therefore the dataset must be partitioned to be processed.
That beloved DataFrame of yours consists of many different chunks representing that dataset in its entirety.
Why is that important? Because if Spark works on these partitions in parallel, than of course maximizing the number or partitions that can be worked on, at the same time, on your particular cluster … will have a large impact on performance and utilizing a cluster to it’s full extent.
Maybe you will end up over provisioning clusters to certain datasets and waste money. Maybe you will under provision clusters and make some pipelines run long.
1. Partitions → Tasks → Executors
-
Each partition = one Spark task in a stage.
-
Tasks are the units of parallel work that Spark schedules across the cluster’s executor cores.
-
If you have more partitions than total available executor cores, tasks will queue and run in waves.
-
If you have fewer partitions than cores, some cores will sit idle.
Tuning shuffle partitions.
Probably one of the most common actions that is resource consuming in Spark pipelines is that infamous “shuffle,” which is for the most part unavoidable. Think about it, if you are doing a groupBy or Join on some large DataFrame with many partitions, clearly those partitions are going to be shuffled around the cluster to complete that join or groupBy.
2. Partition Size and Shuffle
-
Default target size for many data sources (e.g., Spark SQL file scans) is ~128 MB per partition (configurable via
spark.sql.files.maxPartitionBytes). -
During shuffles (e.g.,
groupBy,join), Spark usesspark.sql.shuffle.partitions(default 200) to decide how many reduce tasks—and thus partitions—the shuffle output will have.
| Number of partitions | Upper bound on concurrent tasks |
| Executor cores × executors | Maximum tasks that can run simultaneously |
| Partition size | Memory/IO efficiency |
spark.sql.shuffle.partitions |
Controls shuffle output parallelism |
Choose enough partitions so that total tasks ≫ total cluster cores and each partition is a reasonable size. That ensures all executors stay busy without creating excessive scheduling overhead. What it comes down to, for most us, following this rule will help optimize out-of-the-box performance.
Match or exceed total cores: A common rule of thumb is at least 2–4× the number of cluster cores for good parallelism.
I’ve done this far years, usually on the lighter size of 1.5 to 2 X the number of cores available on my Spark clusters.
Spark and Databricks has gotten smarter.
Honestly, for many years before Databricks was popular, and was just starting to rise, I would ask myself … “If this calculation for spark.sql.shuffle.partitions is so simple, why can’t Spark simply just do this calculation itself? Well, partly because it’s complicated and my understanding is simplistic, BUT there have been great strides in new versions of Spark and Databricks to walk down this path.
-
Spark 3.0+ (and all modern Databricks runtimes) use Adaptive Query Execution (AQE) plus improved file-source scanning.
-
By default
spark.sql.files.maxPartitionBytes(128 MB) andspark.sql.files.openCostInBytesguide how many partitions Spark creates at read time. -
Historically, the shuffle output was fixed by
spark.sql.shuffle.partitions(default 200). -
AQE (enabled by default in Databricks Runtime 7.3 LTS and all newer) can dynamically coalesce shuffle partitions at runtime:
-
It starts with the configured upper bound (e.g. 200).
-
While running, it measures actual shuffle file sizes.
-
It merges partitions so each is near
spark.sql.adaptive.advisoryPartitionSizeInBytes(default 64 MB).
-
-
The initial upper bound still comes from
spark.sql.shuffle.partitions(or explicitrepartition()calls). -
AQE will reduce, but not automatically increase beyond that bound.
-
For massive datasets on big clusters, you might raise that setting (or call
repartition()) to ensure enough parallelism before AQE can shrink.
Interesting eh? Cleary if the creators and maintainers of Spark are putting this much work into these features, than they are extremely important to performant Spark execution. But, why leave your Spark data processing to chance? It’s easy enough to figure out your number of cores on the cluster and set your spark.sql.shuffle.partitions to match (2x maybe).
Let’s test these theories on Databricks shall we?
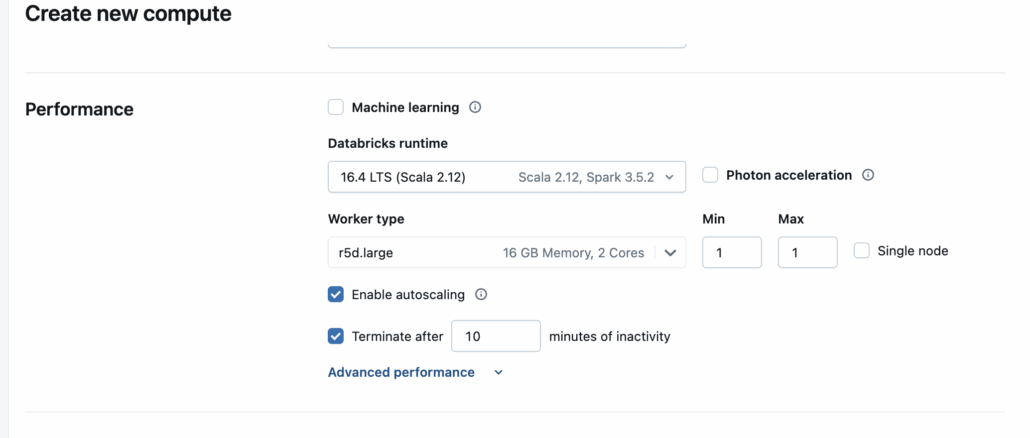
You know, it’s one thing to talk about this stuff at an academic level, I find it helpful to play with datasets and settings in real life on a real Spark platform, like Databricks, and see what happens. Let’s just do that. I have my personal Databricks account we can use, let’s setup the smallest cluster possible, get us a dataset, do some simple aggregation, play with spark.sql.shuffle.partitions and let the chips fall where they may.
First off, we will start with 50Gbs on CSV data from BackBlaze hard drive open source dataset. I downloaded this dataset and put it on S3.

This dataset removes around hard drives inside a data center, their make, model etc, if if they failed or not. So we will do a simple query in Spark to see over a long period of time, which hard drive models are failing every day. This is what the data looks like.

Ok, so let’s get us a nice Databricks cluster setup, smallest we can find. r5d.large with 16GB of memory, a single node.
Next, let’s write us up a Spark query that will aggregate the previous data, and do some tweaking of partitions and see how it affects the runtime of said script. This is by no means a scientific method, but more about seeing at a high level, if partition configs do indeed affect Spark performance.
I mean, we are using Spark 3.0+ so technically AQE is on, so maybe all this work is for nothing and we won’t see a difference at all, time will tell.
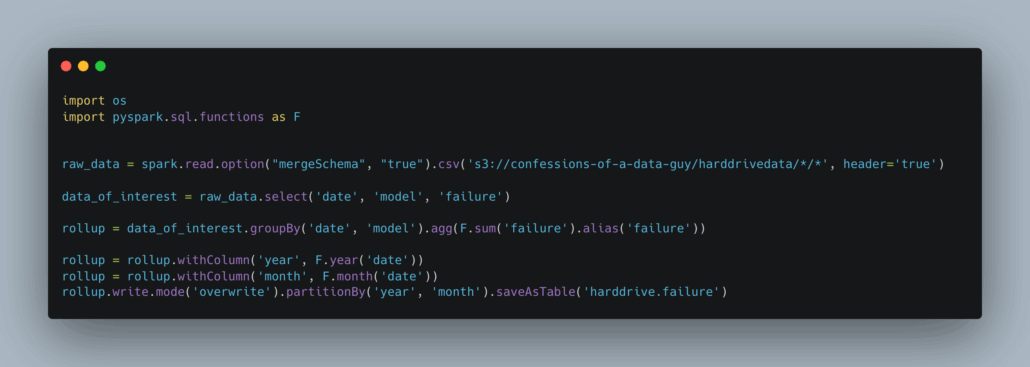
So, here is our very straight forward and simple code.
- read the 50GBs of CSV files
- select the columns we are interested in
- groupBy date and model
- count the failures
- add columns for year and month
- partition by them
- write the dataset
(yes I know the partitions don’t make sense and are excessive, but remember we are just trying to make Spark work more than anything).
I also understand Spark and Databricks might cache() data etc, so I’m restarting a new Spark session for every run, and I run the code at least, before starting to log the performance results.
The idea here is I want Spark to have to shuffle the data around a lot. We are going to do a few runs, here’s what I have in mind, and I will run each of the scenarios 3 times, and take that average.
- no config changes Spark ala Databricks with above cluster, zero changes.
- setting
spark.sql.shuffle.partitionsto 2.5 X the number of cores we have on the cluster (5)
In this case our single node cluster only has 2 cores. Remember, the default for this setting is 200, and that is WAY to many for our cluster size and core count, so I would expect the option 1 above to be the slowest, but we shall see.

Who know’s how accurate this is, but it pretty much matches my expectations. When the
spark.sql.shuffle.partitionsare left at the default 200, which is way to many for our small cluster … the runtime is a few minutes slower than tuning that to be much lower (around 5).
I’m going to assume the larger the datasets and clusters, the more pronounced the difference would be.
So, we learned something today eh?
It can be worth our time to poke around the edge of technology we are used to using, you never know what you fill find and learn. It’s always good to keep the old brain wheels turning and greased. Learning stuff, even if we are wrong, is part of a long drawn out process that makes us work a little bit harder than those around us.
This sort of curiosity and playing will pay off over the lifetime.

