Dask vs PySpark – Performance and Other Thoughts.

Every once in awhile I see someone talking about their wonder distributed cluster of Dask machines, and my curiosity gets aroused. I know plenty of people use Dask, mostly on their local machines, but it seems like the meteoric rise of Spark, especially with tools like EMR and Databricks, that Dask is slowly slipping into the shadows. I’ve had bad experiences with Dask in the past, trying to get it work well in production. I suppose that comes from working with tried and true Spark and other bullet proof distributed system. I’ve been meaning to return to Dask for awhile, compare a similar Dask and Spark cluster on performance … and other things like ease of setup and writing code. Let’s get too it.
Dask vs PySpark
First things first. I want to muse about what someone would be looking for in a distributed data processing engine. We all want the same thing in the end really.
- reliability and fault tolerance
- ability to process large amounts of data
- easy to use APIs
- approachable data model (think dataframe)
- many and varied data sources and sinks (parquet, cloud storage, csv, json, blah)
- decent UI when needed
I think it’s important to point out that many times performance is just a side note, or assumed. We just assume the performance is going to be reasonable and we look to the surrounding features of a distributed compute system to be well rounded.
Today’s world of data engineer’s architecture seems to be made up a number of tools, rarely is it just a single tool doing all the work. Many times there is a tool like Airflow doing the orchestration and dependency management, different data sources ranging from relational databases to files in cloud storage.
We don’t want to have worry about complexities of managing tools, aka the rise of Databricks and Snowflake. We want an approachable way to work with our data, and Python API’s are practically the de-facto standard for any tool now.
How should we compare Dask vs PySpark?
The best way to compare Dask and PySpark is just to install a cluster of each tool, and write a simple but normal ETL pipeline. Let’s face it, many people can argue about specific use cases like Machine Learning, and their might be a time for this, but as someone who’s been around production ML, 90% of even specialized ML pipelines is just normal data movement, transformations, and analytics.
Of course in our case, out of curiosity, we want to test the performance of Dask vs Spark on the same size cluster with the same data.
Installing a 3 node Dask cluster.
There are of course many ways to install Dask, but we will just go the manual SSH/command line route. I feel like getting “close” to the tools you are working with at least once is a great way to deepen the understanding and challenges when starting out. Things like Kubernetes and Helm are awesome for easily deploying tools quickly, but let’s keep it simple today.
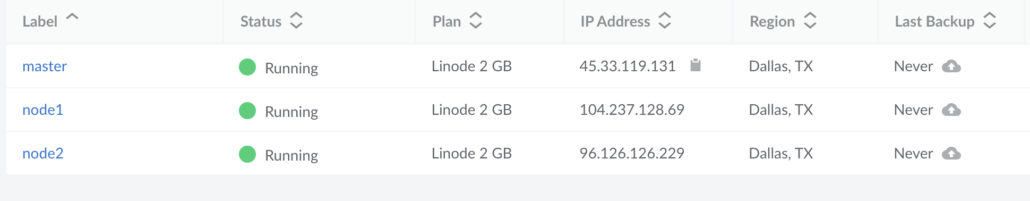
Here is a screenshot of my Linode machines for our cluster. Three different machines ready to be used. Feel free to try and hack my machines, they will be gone by the time you’re read this. 🙂
Dask high level distributed overview.
Dask is apparently like the myriad of other distributed compute tools, you get one master/scheduler and then as many workers as you please.
Apparently it’s common to use a resource manager like Yarn, Mesos, etc to deploy Dask on. We won’t be doing that in this example, I’m more curious about the implementation of Dask vs Spark, rather than the nuances of particular infrastructures.
- Install Dask on each node
- Start scheduler on master.
- Start workers on each node and connect to master.
Installing a Dask cluster.
I’m going to start by following these instructions and pip installing Dask on each node. My nodes are running Ubuntu 18.04 LTS. The default python3 version is Python 3.6.9. This makes me a little nervous because Python installs before 3.8 anymore with most tools are usually a nightmare.
Anyways… below is the command I ran to install Dask.
python3 -m pip install "dask[complete]"
Of course immediatley I get an error. Can’t install pillow.
The headers or library files could not be found for zlib,
  a required dependency when compiling Pillow from source.
Failed building wheel for pillow
----------------------------------------
Command "/usr/bin/python3 -u -c "import setuptools, tokenize;__file__='/tmp/pip-build-1ka816dj/pillow/setup.py';f=getattr(tokenize, 'open', open)(__file__);code=f.read().replace('\r\n', '\n');f.close();exec(compile(code, __file__, 'exec'))" install --record /tmp/pip-a_9sugjh-record/install-record.txt --single-version-externally-managed --compile" failed with error code 1 in /tmp/pip-build-1ka816dj/pillow/
The internet said it might be pip version. So I tried this python3 -m pip install pip==19.3.1
That fixed the issue.
Successfully installed bokeh-2.3.3 dask-2021.3.0 fsspec-2021.8.1 pillow-8.3.2Starting the Dask scheduler and workers.
Apparently super easy to start the scheduler on master node.
dask-scheduler
distributed.scheduler - INFO - -----------------------------------------------
distributed.http.proxy - INFO - To route to workers diagnostics web server please install jupyter-server-proxy: python -m pip install jupyter-server-proxy
distributed.scheduler - INFO - -----------------------------------------------
distributed.scheduler - INFO - Clear task state
distributed.scheduler - INFO - Scheduler at: tcp://45.33.119.131:8786
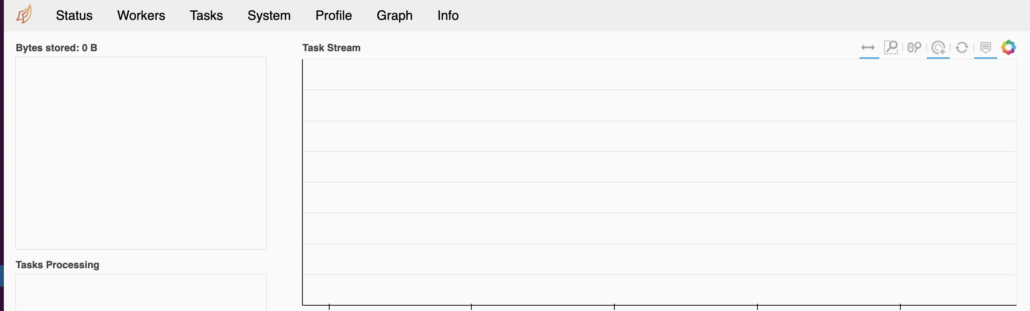
distributed.scheduler - INFO - dashboard at: :8787Well it’s sure nice to see the Dashboard show up right away.
Let’s start the two worker nodes. Running the following command feeding in the master uri location.
dask-worker tcp://45.33.119.131:8786
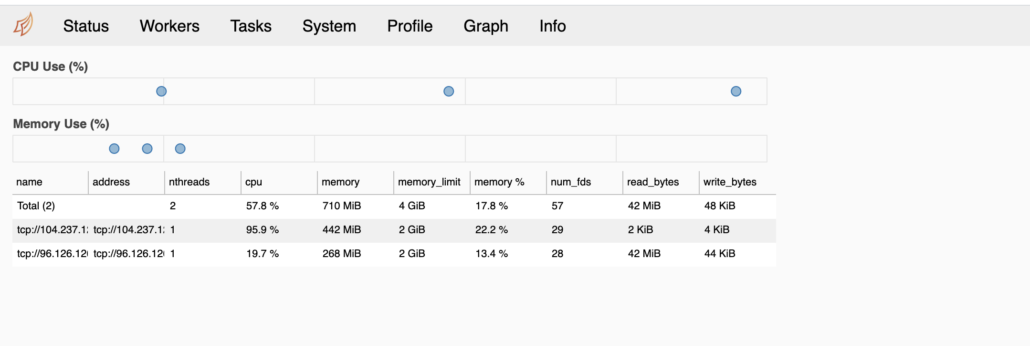
Now we can see the two workers in the UI.
Running a distributed Dask workload.
So the setup was fairly simple and straight forward. I can see the allure for Dask from this perspective, the underlying setup and required installation is as easy at it comes for sure. I can see how easy and powerful it would be to containerize this simple setup and put it on Kubernetes. I like the nice UI provided, it helps to be able to see what’s going on with your cluster, takes out a little guesswork.
What I want to do now is run a simple ETL and compute process on some data. I want to see how the code is structured and the performance. Let’s use some open source covid data sets stored on s3.
I’m going to use the open source Taxi trip data set from NYC, found on s3 here, and available for use by anyone.
I just want to test a simple script to see how Dask reacts before I write any computations.
from dask.distributed import Client
import dask.dataframe as dd


client = Client('45.33.119.131:8786')

df = dd.read_csv('s3://nyc-tlc/trip data/yellow_tripdata_*.csv', storage_options={'anon': True, 'use_ssl': False})
print(df.head())
If you’re curious about the storage_options={'anon': True, 'use_ssl': False} that’s basically saying don’t pass credentials as this is a public s3 bucket and they are not needed.
Running this at the command line python3 test.py results in the error…
    raise ImportError(bit["err"]) from e
ImportError: Install s3fs to access S3
I assumed when I installed python3 -m pip install "dask[complete]" per the documentation it gives you every dependency available, apparently not?
I guess I will go on each node and pip3 install s3fs
Ok, we try again. Success.
root@localhost:~# python3 test.py
VendorID tpep_pickup_datetime tpep_dropoff_datetime passenger_count ... tolls_amount improvement_surcharge total_amount congestion_surcharge
0 1 2020-01-01 00:28:15 2020-01-01 00:33:03 1 ... 0.0 0.3 11.27 2.5
1 1 2020-01-01 00:35:39 2020-01-01 00:43:04 1 ... 0.0 0.3 12.30 2.5
2 1 2020-01-01 00:47:41 2020-01-01 00:53:52 1 ... 0.0 0.3 10.80 2.5
3 1 2020-01-01 00:55:23 2020-01-01 01:00:14 1 ... 0.0 0.3 8.16 0.0
4 2 2020-01-01 00:01:58 2020-01-01 00:04:16 1 ... 0.0 0.3 4.80 0.0
5 2 2020-01-01 00:09:44 2020-01-01 00:10:37 1 ... 0.0 0.3 3.80 0.0
6 2 2020-01-01 00:39:25 2020-01-01 00:39:29 1 ... 0.0 0.3 3.81 0.0
7 2 2019-12-18 15:27:49 2019-12-18 15:28:59 1 ... 0.0 0.3 2.81 2.5
8 2 2019-12-18 15:30:35 2019-12-18 15:31:35 4 ... 0.0 0.3 6.30 2.5
9 1 2020-01-01 00:29:01 2020-01-01 00:40:28 2 ... 0.0 0.3 14.15 2.5
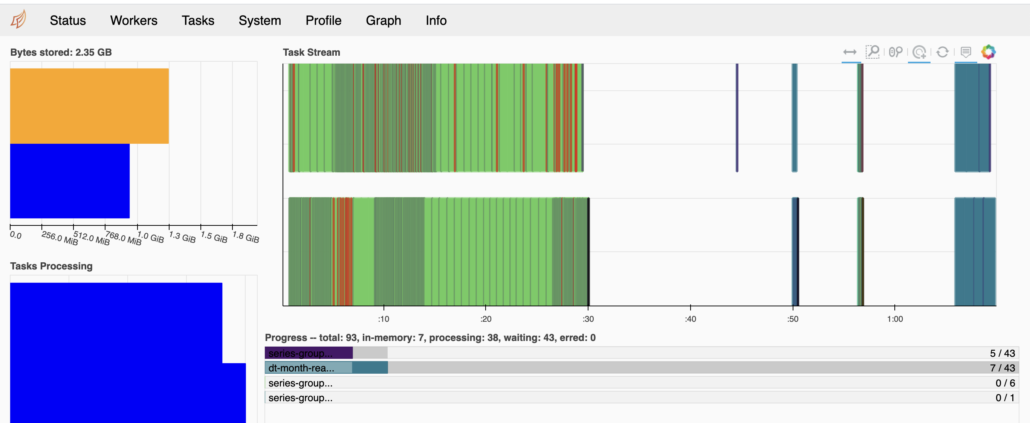
[5 rows x 18 columns]Great, let’s just try a simple sum of Total_Amt grouped by year and see what happens. I can see in the UI Dask is working hard.
Here is the code … Basically read 2020 trip data files and group by the month, summing the total charged. It’s only about 2.171 GBs of data over 12 files.
from dask.distributed import Client
import dask.dataframe as dd
from datetime import datetime

t1 = datetime.now()
client = Client('45.33.119.131:8786')

df = dd.read_csv('s3://nyc-tlc/trip data/yellow_tripdata_2020*.csv', storage_options={'anon': True, 'use_ssl': False})
df = df.astype({'tpep_pickup_datetime': 'datetime64[ns]'})
df = df.groupby(df.tpep_pickup_datetime.dt.month).total_amount.sum()
df.to_csv('results')
t2 = datetime.now()
print("it took {x} to run the analysis".format(x=t2-t1))
Immediately the script pukes with some data type errors …. I’m surprised it doesn’t fall back to a string if it finds mixed types.
ValueError: Mismatched dtypes found in `pd.read_csv`/`pd.read_table`.

+-----------------+---------+----------+
| Column          | Found   | Expected |
+-----------------+---------+----------+
| RatecodeID      | float64 | int64    |
| VendorID        | float64 | int64    |
| passenger_count | float64 | int64    |
| payment_type    | float64 | int64    |
+-----------------+---------+----------+

Usually this is due to dask's dtype inference failing, and
*may* be fixed by specifying dtypes manually by adding:

dtype={'RatecodeID': 'float64',
       'VendorID': 'float64',
       'passenger_count': 'float64',
       'payment_type': 'float64'}
I’m going to try and bypass this error by simply reading all the dtypes as string … aka object in Dask, mostly because I don’t care about all of the columns but two.
from dask.distributed import Client
import dask.dataframe as dd
from datetime import datetime
t1 = datetime.now()
client = Client('45.33.119.131:8786')
dtype={'VendorID': 'object', 'tpep_pickup_datetime': 'object', 'tpep_dropoff_datetime': 'object',
'passenger_count': 'object', 'trip_distance': 'object', 'RatecodeID': 'object', 'store_and_fwd_flag': 'object',
'PULocationID': 'object', 'DOLocationID': 'object', 'payment_type': 'object', 'fare_amount': 'object', 'extra': 'object',
'mta_tax': 'object', 'tip_amount': 'object', 'tolls_amount': 'object', 'improvement_surcharge': 'object',
'total_amount': 'object', 'congestion_surcharge': 'object'}
df = dd.read_csv('s3://nyc-tlc/trip data/yellow_tripdata_2020*.csv', dtype=dtype, storage_options={'anon': True, 'use_ssl': False})
df = df.astype({'tpep_pickup_datetime': 'datetime64[ns]'})
df = df.groupby(df.tpep_pickup_datetime.dt.month).total_amount.sum()
df.to_csv('results')
t2 = datetime.now()
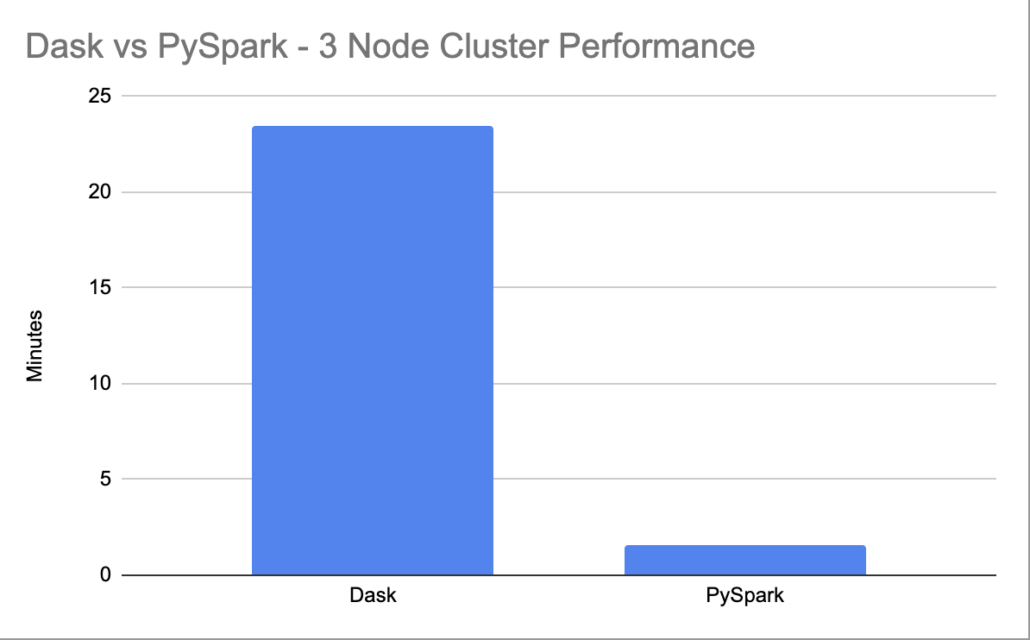
print("it took {x} to run tha analysis".format(x=t2-t1))It took an incredible amount of time.
it took 0:23:48.169446 to run the analysis
I mean did I do something wrong? 23 minutes is crazy land. I know I should be running Dask on a large dataset say 200GB at least, but still. Surely this doesn’t inspire confidence. Makes me wonder if I’m missing something obvious or doing something terrible all the Daskites will email me about.
Doing the same thing in Spark.
I’m not going to go through every nuance of setting up a Spark cluster, I’ve done that a few times before. Generally here are the steps I took.
- install java and scala
- setup ssh password-less
- install spark
- set hosts and worker file configs
- find correct s3 package to use.
from pyspark.sql import SparkSession, DataFrame, Window
import pyspark.sql.functions as F
from datetime import datetime


t1 = datetime.now()
spark = SparkSession.builder.appName('SparkVsDask').getOrCreate()
spark.sql("set spark.sql.legacy.timeParserPolicy=LEGACY")

df = spark.read.csv('s3a://nyc-tlc/trip data/yellow_tripdata_2020*.csv',header='true')
df = df.withColumn('date',F.to_date('tpep_pickup_datetime', 'YYYY-MM-dd'))
df = df.groupBy(F.month(F.col('date'))).agg(F.sum('total_amount')).alias('amt')
df.coalesce(1).write.csv('results')

t2 = datetime.now()
print("it took {x} to run tha analysis".format(x=t2-t1))
/usr/local/spark/bin/spark-submit --packages com.amazonaws:aws-java-sdk:1.7.4,org.apache.hadoop:hadoop-aws:2.7.0 ptest.py --master spark://45.33.119.131:7077I’m not sure what to say, but it took Spark a whole it took 0:01:58.453626 to run the analysis.
Sorta at a loss here for why the Dask client using the same cluster had such a problem and took over 20 minutes to run the code.
I changed the Spark read to look at 2019 files, so about 8 GB instead of 2GB. it took 0:06:03.517517 to run the analysis
Struggling to understand Dask’s performance issues.
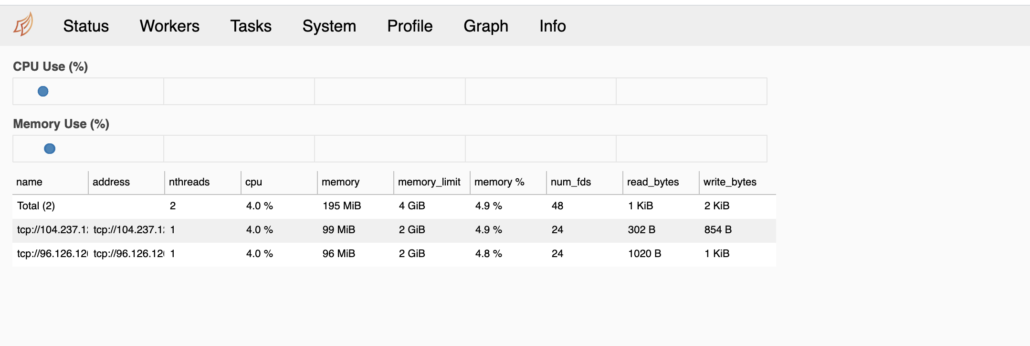
It’s possible I’m doing something completely wrong with Dask, since I am unfamiliar with it on a cluster. But from all appearance in the UI, the worker nodes are showing up and when the script is churning, you can see the CPU and Memory on both worker nodes hard at work.
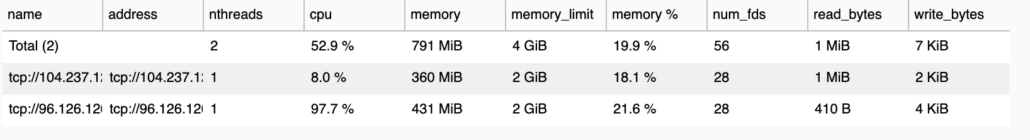
It does bother me that the memory pressure is so low, you would think it would use as much memory as possible?
The only reasonable explanation I can come up with for such poor Dask performance on a cluster with very small datasets … is Dask’s internode and data shuffling communication that bad? Also I noticed the CPU’s were more pegged most of the time, this might be a clue.
I found notes in the Dask documentation about switching to use more processes rather than threads. I relaunched the Dask workers with a new configuration.
dask-worker tcp://45.33.119.131:8786 --nprocs 4 --nthreads 1Let’s re-run our small dataset and see if we gain Dask some performance. This was a mistake, took so long I killed it.
Musings on Dask vs Spark.
The installation between the two clusters was very similar. I would say I can see the benefit of using Dask, it’s very simple and with installing everything you need via pip, it does make it a nice option. Having worked and installed various Spark clusters and setups over the years, all the strange Java errors and having to get everything exactly right …. that does get old sometimes.
Writing code is Dask itself is pretty straight forward, it mirrors Pandas and is very similar to dataframe operations in Spark.
I did find the Dask documentation a little confusing, especially for Cluster setups. I think they need a good Best Practices doc or still more basic overviews of the distributed computing with Dask, what to look out for, how to configure things, etc.
I feel as if I’m missing the picture with Dask cluster computing, I can’t get past the poor performance, and I tried a number of different configurations.
I found Dask a little more approachable then last time I tried it, not so buggy, but I fail to see why a person would choose Dask over PySpark.