Databricks Metric Views and the Reality of the Semantic Layer
I’ve written before about the elusive “Semantic Layer,” that mythical construct every data team eventually talks about building. It’s the idea of pulling all business logic, calculations, and definitions into a single place so everyone agrees on what the numbers actually mean. Anyone who has worked in data long enough knows the pain this is trying to solve. Logic gets scattered across pipelines, dashboards, notebooks, and random scripts, and before long, no one can explain why two reports show different answers for the same metric.
Despite decades of industry experience, we still struggle with this. Data teams continue to fight their way through repos, documentation, and tribal knowledge just to understand how a number is calculated. It’s not that we don’t know better—it’s that systems naturally drift toward complexity and inconsistency over time.
- That’s where Databricks Metric Views come in. Whether you believe in the idea of a formal semantic layer or not is beside the point. If you’ve felt the pain of misaligned metrics and scattered logic, then some form of centralization becomes attractive. Metric Views are Databricks’ attempt to solve that problem in a structured, governed way.
The funny thing about the semantic layer is that no one fully agrees on what it actually is. Different vendors define it slightly differently, but there are a few common threads. It sits between the data and the end user, it standardizes metrics and definitions, and it often includes governance and access control. Beyond that, things start to diverge. Some implementations include transformations, others focus strictly on definitions, and some blur the line between modeling and analytics.
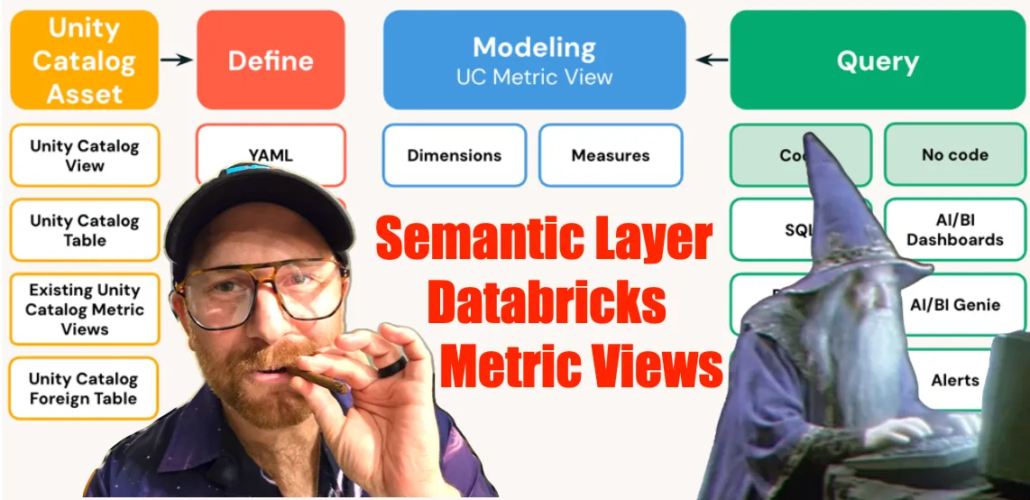
Databricks’ take is fairly pragmatic. Metric Views are first-class objects in Unity Catalog that allow you to define business metrics and dimensions once, and then reuse them consistently across tools like SQL, dashboards, and AI-driven interfaces. They behave somewhat like views, but with additional structure and metadata that make them more expressive from a business standpoint.
At their core, Metric Views are about making business logic explicit. Instead of burying calculations inside pipelines or dashboards, you define dimensions and measures in a centralized place. This includes everything from simple counts to more complex aggregations and derived metrics. The structure is verbose by design, forcing you to be clear about what each metric represents and how it is calculated.
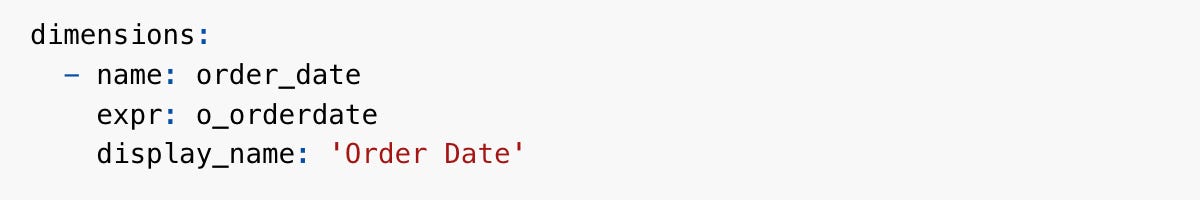
What’s interesting is how Databricks chose to implement this. Metric definitions can be expressed in a YAML-like structure layered on top of SQL, which makes them both human-readable and programmatically consistent. It’s not necessarily what people expect at first, but it does make the intent of each metric very clear. You’re no longer just writing a query—you’re defining a reusable, governed concept.
CREATE OR REPLACE VIEW confessions.default.trips_metrics
(ride_date COMMENT 'Date of trip (from started_at)',
ride_month COMMENT 'Month bucket (from started_at)',
member_type COMMENT 'member vs casual',
rideable_type COMMENT 'Type of bike/ride',
start_station COMMENT 'Start station name',
end_station COMMENT 'End station name',
route COMMENT 'Start → End route label',
total_rides COMMENT 'Total rides',
member_rides COMMENT 'Rides where member_casual = member',
casual_rides COMMENT 'Rides where member_casual = casual',
avg_trip_minutes COMMENT 'Average trip duration (minutes)',
total_unique_start_stations COMMENT 'Proxy: unique start stations',
total_unique_routes COMMENT 'Proxy: unique routes (start→end)')
WITH METRICS
LANGUAGE YAML
COMMENT 'Metric View for trips: rides by day/month, membership split, popular stations/routes, durations.'
AS $$
version: 0.1
source: confessions.default.trips
filter: TO_TIMESTAMP(started_at) IS NOT NULL
dimensions:
- name: ride_date
expr: TO_DATE(TO_TIMESTAMP(started_at))
- name: ride_month
expr: DATE_TRUNC('MONTH', TO_TIMESTAMP(started_at))
- name: member_type
expr: member_casual
- name: rideable_type
expr: rideable_type
- name: start_station
expr: COALESCE(start_station_name, 'UNKNOWN')
- name: end_station
expr: COALESCE(end_station_name, 'UNKNOWN')
- name: route
expr: CONCAT(COALESCE(start_station_name, 'UNKNOWN'), ' → ', COALESCE(end_station_name, 'UNKNOWN'))
measures:
- name: total_rides
expr: COUNT(1)
- name: member_rides
expr: COUNT(1) FILTER (WHERE member_casual = 'member')
- name: casual_rides
expr: COUNT(1) FILTER (WHERE member_casual = 'casual')
- name: avg_trip_minutes
expr: |
AVG(
(UNIX_TIMESTAMP(TO_TIMESTAMP(ended_at)) - UNIX_TIMESTAMP(TO_TIMESTAMP(started_at))) / 60.0
)
- name: total_unique_start_stations
expr: COUNT(DISTINCT start_station_id)
- name: total_unique_routes
expr: COUNT(DISTINCT CONCAT(COALESCE(start_station_id, 'UNK'), '->', COALESCE(end_station_id, 'UNK')))
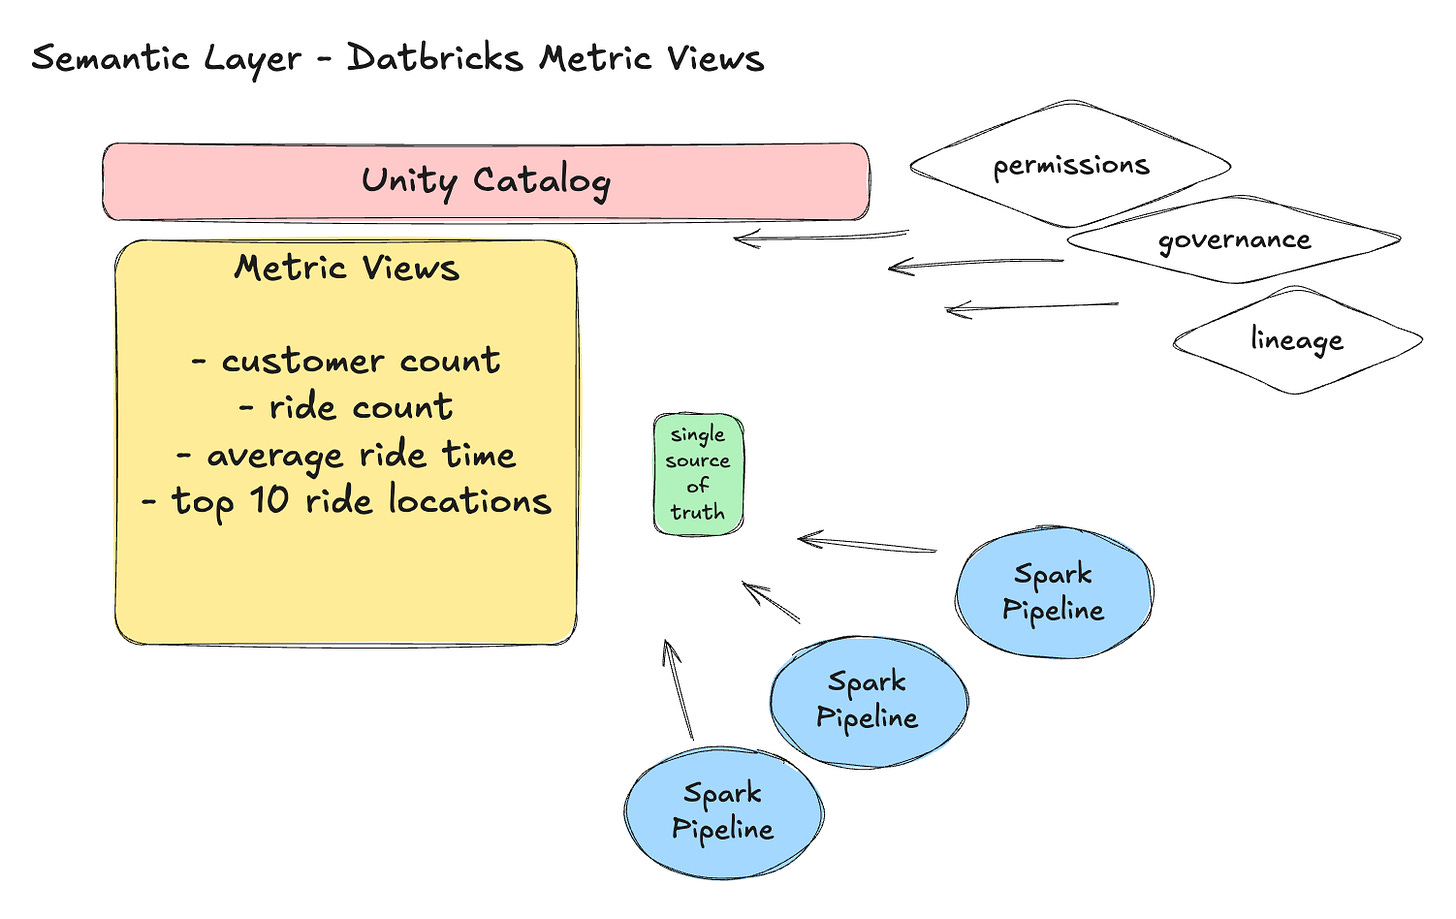
$$;From a systems perspective, this is exactly what a semantic layer is supposed to do. It provides a single source of truth for metrics and ensures that teams, tools, and workflows use the same definitions. Instead of duplicating logic across multiple pipelines, you centralize it and enforce consistency.
Of course, none of this is entirely new. Anyone familiar with traditional BI tools or data warehouses has seen similar ideas before. The difference here is the degree of integration between this approach and the rest of the platform. Because Metric Views live in Unity Catalog, they inherit capabilities such as permissions, lineage tracking, and governance. This becomes increasingly important as organizations grow and more teams rely on shared data assets.

There are also practical considerations. Like traditional views, Metric Views can be computed on demand or materialized, introducing the usual trade-offs between freshness and performance. If you’re comfortable with SQL views, this behavior will feel familiar. The key difference is that you’re now working at a higher level of abstraction, focused on business meaning rather than just query logic.
What makes this especially relevant today is the rise of AI-driven analytics. As more systems rely on LLMs and agents to query and interpret data, having well-defined, consistent metrics becomes even more important. Databricks is clearly thinking ahead here, incorporating semantic metadata such as display names and synonyms to help both humans and machines understand the meaning of the data.
At the end of the day, the semantic layer is as much a mindset as it is a technology. It requires teams to be disciplined about how they define and manage metrics, and to treat business logic as a first-class concern rather than an afterthought. Without that discipline, even the best tools will fall short.
Most data teams have experienced what happens when this discipline is missing. Over time, systems become fragmented, numbers stop matching, and trust in the data erodes. Once that trust is gone, it’s incredibly difficult to regain. Centralizing metrics through something like Metric Views won’t solve every problem, but it can go a long way toward preventing that breakdown.
The real question isn’t whether you should use a semantic layer; it’s how you plan to manage your metrics if you don’t. Because if there’s one thing history has shown us, it’s that leaving business logic scattered across systems eventually leads to the same outcome: confusion, inconsistency, and a loss of confidence in the data.
Metric Views are one attempt to address that reality. Whether they become the standard or just another step in the evolution of data platforms remains to be seen, but the problem they’re trying to solve isn’t going away anytime soon.

