Exploring LendingTree Data with Python/SQL
One of the biggest hurdles I’ve found when teaching myself any sort of SQL/Python/Data Wrangling skills is the problem of finding usable, real life data to work with. Data that I can actually attempt to answer questions with.
There is no better way to learn than to be given a data set, in it’s raw form and then try to get the data into a form where you can do something fun with it.
Enter LendingTree open source data. Man, when I found this it was like data heaven. https://www.lendingclub.com/info/download-data.action
Here you will be given the option of downloading csv files of data from LendingTree, with a bunch of data about the loans given on that platform.
The first step was to download all 11 files over the different time spans. This is the real world right?
I didn’t want to sign in to get the full file or whatever, i just wanted the data, free, now. Bam, now i have 11 files full of data.
Next i just opened the smallest file and decided which columns I actually wanted to mess around with, what looked interesting, and I junked the rest (deleted). The original files are very wide with a bunch of junk, i figured
this would make things run a little faster.
In the end I got 1,765,426 rows all about loans done by LendingTree between 2007 and 2017.
I then just created a rough staging table in SQL Server to hold the columns that I wanted to hold the data from the csv files.
I always use large NVARCHAR columns to avoid any truncation or other data related problems. We can update data types later by altering columns. Plus I did some other obvious cleanup in SQL.
CREATE TABLE [dbo].[LendingTree](
	[Loan_Amount] [nvarchar](500) NULL,
	[Funded_Amount] [nvarchar](500) NULL,
	[Funded_Amount_Inv] [nvarchar](500) NULL,
	[Term] [nvarchar](500) NULL,
	[Interest_Rate] [nvarchar](500) NULL,
	[Installment] [nvarchar](500) NULL,
	[Grade] [nvarchar](500) NULL,
	[Home_Ownership] [nvarchar](500) NULL,
	[Annual_Income] [nvarchar](500) NULL,
	[Verification_Status] [nvarchar](500) NULL,
	[Issue_Date] [date] NULL,
	[Loan_Status] [nvarchar](500) NULL,
	[Address_State] [nvarchar](500) NULL,
	[Open_Accounts] [nvarchar](500) NULL,
	[Application_Type] [nvarchar](500) NULL
)

DELETE FROM [Configuration].[dbo].[LendingTree] WHERE Issue_Date = '1900-01-01'
ALTER TABLE [Configuration].[dbo].[LendingTree] ALTER COLUMN Loan_Amount BIGINT
ALTER TABLE [Configuration].[dbo].[LendingTree] ALTER COLUMN Funded_Amount BIGINT
UPDATE [Configuration].[dbo].[LendingTree]  SET Interest_Rate = REPLACE(Interest_Rate,'%','')
ALTER TABLE [Configuration].[dbo].[LendingTree] ALTER COLUMN Interest_Rate DECIMAL(18,2)
ALTER TABLE [Configuration].[dbo].[LendingTree] ALTER COLUMN Installment DECIMAL(18,2)
UPDATE [Configuration].[dbo].[LendingTree] SET Annual_Income = 0 WHERE Annual_Income = ''
ALTER TABLE [Configuration].[dbo].[LendingTree] ALTER COLUMN Annual_Income DECIMAL(18,2)
ALTER TABLE [Configuration].[dbo].[LendingTree] ALTER COLUMN Open_Accounts Int

CREATE NONCLUSTERED INDEX IDX_LendingTree ON dbo.LendingTree (Issue_Date,Loan_Amount) INCLUDE(Funded_Amount, Interest_Rate,Installment,Home_Ownership,Annual_Income,Address_State,Open_Accounts)
HaHa. Done with the easy part, now it’s on to the problem of actually getting the data from my csv files into SQL Server.
This is another reason I love Python, not only is it fun to use, easy to learn, but there is a million ways to write the same thing, and usually it is short and sweet. I’m no Python expert. Here is my code to import the files.
import os
import csv
import pyodbc

#list files in directory
def listFiles():
	files = os.listdir('C:\\Users\\Daniel.Beach\\Desktop\\LendingCLubData')
	return files

#read a row in a file
def fileToRow(fullfile):
	with open(fullfile, 'r') as f:
		reader = csv.reader(f)
		next(reader) #skip header
		for row in reader:
			yield row

#take a row and put it in SQL Server
def rowToSQL(row):
	cnxn = pyodbc.connect('DRIVER={SQL Server};SERVER=YourServer;DATABASE=YourDatabase;UID=UserName;PWD=Passwpord') #connect
	cursor = cnxn.cursor() #open cursor
	for column in row:
		la = column[0]
		fa = column[1]
		fai = column[2]
		term = column[3]
		ir = column[4]
		i = column[5]
		g = column[6]
		ho = column[7]
		ai = column[8]
		vs = column[9]
		id = column[10]
		ls = column[11]
		ads = column[12]
		oa = column[13]
		at = column[14]
		query = cursor.execute("INSERT INTO dbo.LendingTree VALUES(?,?,?,?,?,?,?,?,?,?,?,?,?,?,?)",la,fa,fai,term,ir,i,g,ho,ai,vs,id,ls,ads,oa,at)
	cnxn.commit()
	print('file done')

def main():
	fileList = []
	l = listFiles()
	for f in l:
		directory = 'C:\\Users\\Daniel.Beach\\Desktop\\LendingCLubData'
		fullfile = os.path.join(directory,f)
		row = fileToRow(fullfile)
		rowToSQL(row)
	cnxn.close()


if __name__ == '__main__':
	main()
Now that the 1,765,426 rows are in my SQL Server, it’s quite easy to do some very simple analysis.
I choose to use Google’s open source Charts to display some of the queries.
https://developers.google.com/chart/ Try it sometime, very easy, fun, and free.
--Here are the SQL Code Snipits.
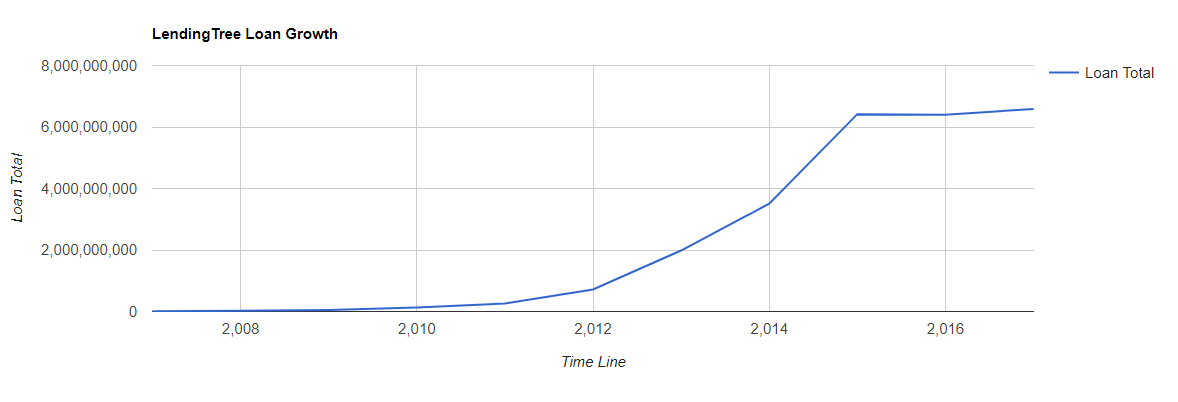
--Loan Amounts by Year
SELECT SUM(Loan_Amount) Total_Loan_Amount,YEAR(Issue_Date) as Year
FROM Configuration.dbo.LendingTree
GROUP BY YEAR(Issue_Date)
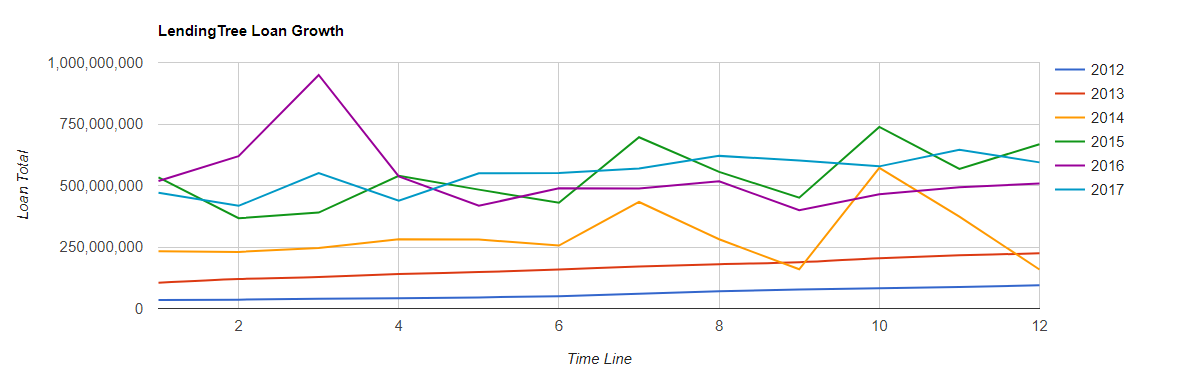
--Loan Amounts by Year and Month
SELECT SUM(Loan_Amount) Total_Loan_Amount,YEAR(Issue_Date) as Year,MONTH(Issue_Date) as Month
FROM Configuration.dbo.LendingTree
GROUP BY YEAR(Issue_Date),MONTH(Issue_Date)
ORDER BY YEAR(Issue_Date), MONTH(Issue_Date) ASC
--Running Sum Year over Year by Month
SELECT Year,Month,SUM(Total_Loan_Amount) OVER (PARTITION BY Year ORDER BY Year,Month ASC ROWS UNBOUNDED PRECEDING) as RunningTotalbyYear
FROM (
SELECT SUM(Loan_Amount) as Total_Loan_Amount,YEAR(Issue_Date) as Year,MONTH(Issue_Date) as Month
FROM Configuration.dbo.LendingTree
GROUP BY YEAR(Issue_Date), MONTH(Issue_Date)
) base
ORDER BY Year,Month
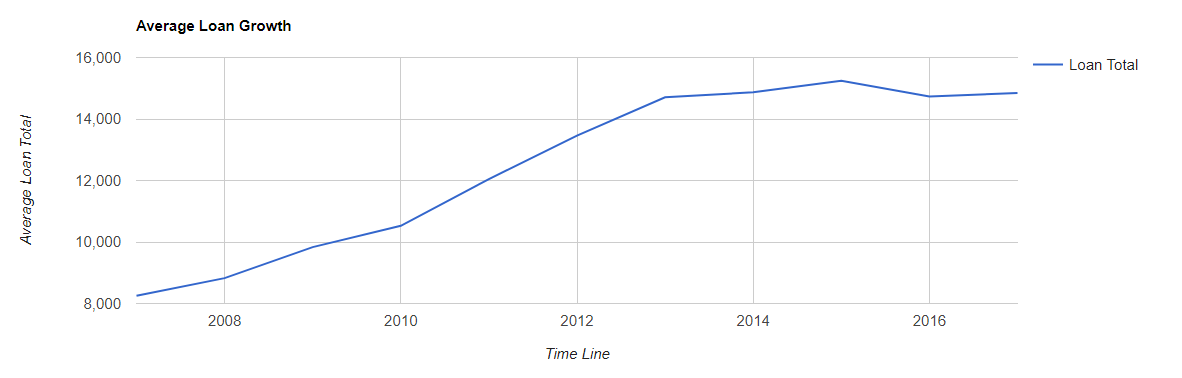
--Avg Loan Size
SELECT AVG(Loan_Amount) Avg_Loan_Amount,YEAR(Issue_Date) Year
FROM [Configuration].[dbo].[LendingTree]
GROUP BY YEAR(Issue_Date)
--Pivot Yr over Yr for Javascript Data Table Consumption
SELECT Month,ISNULL([2007],0)[2017],[2008],[2009],[2010],[2011],[2012],[2013],[2014],[2015],[2016],[2017]
FROM (
SELECT MONTH(Issue_Date) Month,YEAR(Issue_Date) Year,SUM(Loan_Amount)Loan_Amount
FROM Configuration.dbo.LendingTree
GROUP BY MONTH(Issue_Date),YEAR(Issue_Date)
) pvt
PIVOT (
SUM(Loan_Amount)
FOR Year IN ([2007],[2008],[2009],[2010],[2011],[2012],[2013],[2014],[2015],[2016],[2017])
) as p
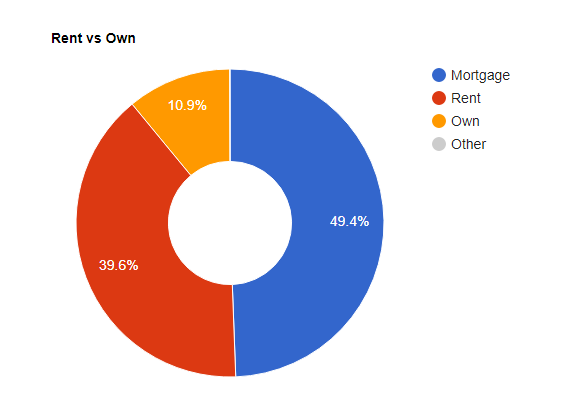
--Rent vs Own
SELECT Home_Ownership, COUNT(*) Number
FROM Configuration.dbo.LendingTree
GROUP BY Home_Ownership
ORDER BY COUNT(*) DESC
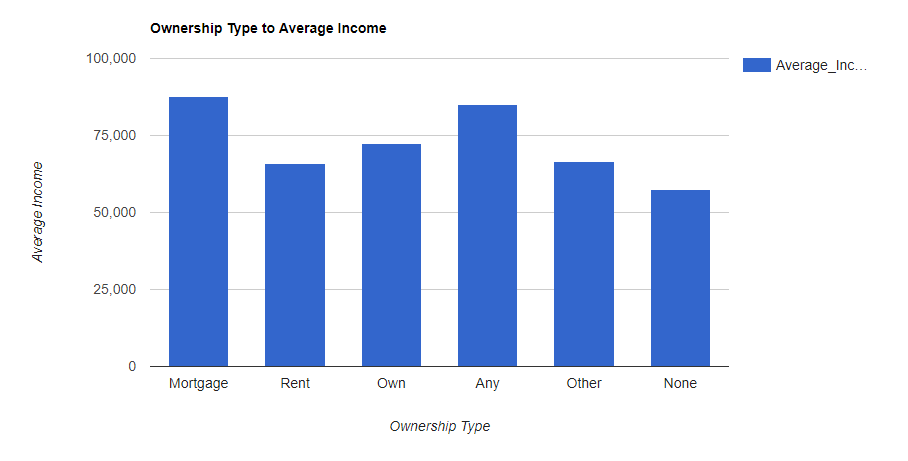
--Average Income vs Home Ownership
SELECT Home_Ownership,AVG(Annual_Income) Average_Income
FROM [Configuration].[dbo].[LendingTree]
GROUP BY Home_Ownership
ORDER BY Average_Income DESC
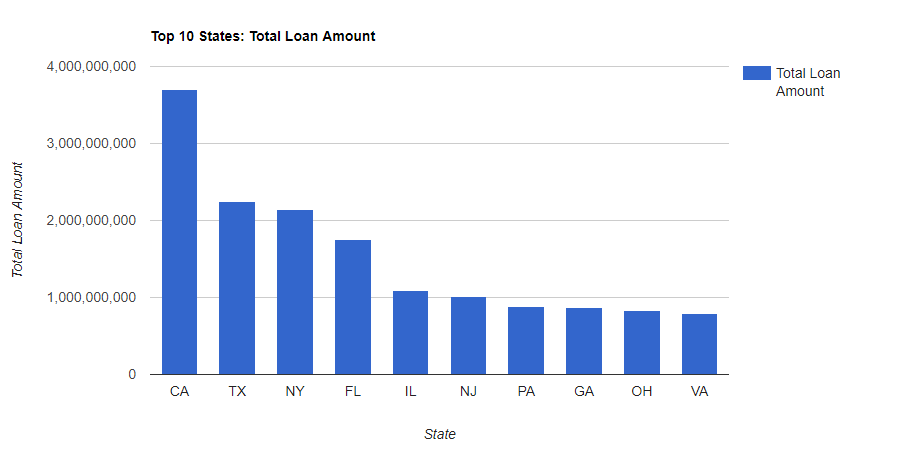
--States with most Total Loans Amounts.
SELECT TOP 10 Address_State,SUM(Loan_Amount) Loan_Amount
FROM [Configuration].[dbo].[LendingTree]
GROUP BY Address_State
ORDER BY Loan_Amount DESC
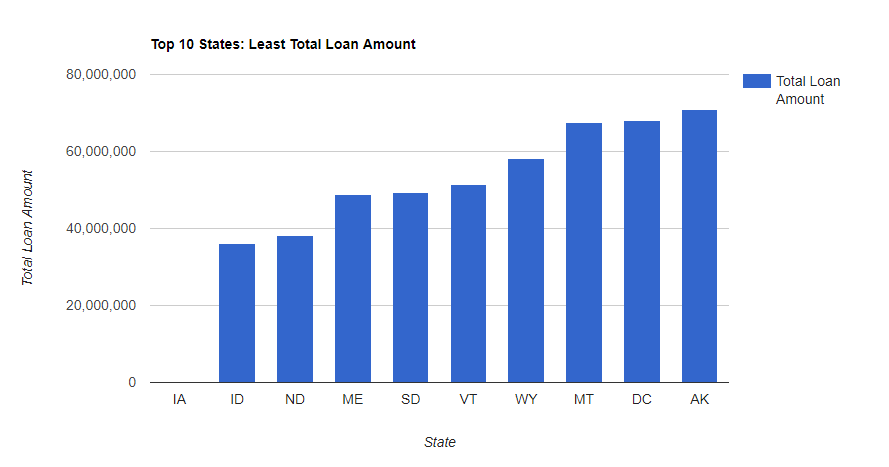
--States with least Total Loans Amounts.
SELECT TOP 10 Address_State,SUM(Loan_Amount) Loan_Amount
FROM [Configuration].[dbo].[LendingTree]
GROUP BY Address_State
ORDER BY Loan_Amount ASC
Next time we are going to try something fun, like try to predict Home Ownership based on a bunch of the other inputs like Annual Income, Interest Rate, Loan Grade, Loan Amount etc.