Build your Data Engineering skills with Open Source Data

There are many a day when I find myself scrolling through the subreddit for r/dataengineerg, it’s a fun place to stalk. Lot’s of people with lots of opinions make for interesting times. I see one question or a variation of it come up over and over again. How do I learn data engineering skills, how do I get into data engineering, what kind of problems do data engineers solve, blah, blah, blah? It’s a great question, and one without an easy answer. Well … there is an answer but it takes some time and willpower to get it done. Open source data. This is the way. Read books, take classes, do whatever, it’s hard to really learn the skills needed day-to-day as a data engineer without actually doing the work. But how do you do the work without the work? Make up your own work I say.
Hone your Data Engineering skills with Open Source Data.
I see so many people these days wanting to get into Data Engineering, wondering what skills and how to build skills that will prepare and ready them for a career. Folks are always looking for projects they can do on their own. It really isn’t that hard and just required a little creativity.
The first problem that comes up is …. where can I get some data to play around with … and then what can I do with it?
First, the best place to look for free data to use is the GitHub awesome-public-datasets repo. It has a list of links and descriptions to data sets you can use for whatever you desire.
Step 1 – Go find a dataset.
In this example I’ve picked some College Score Card data provided by the U.S. government.
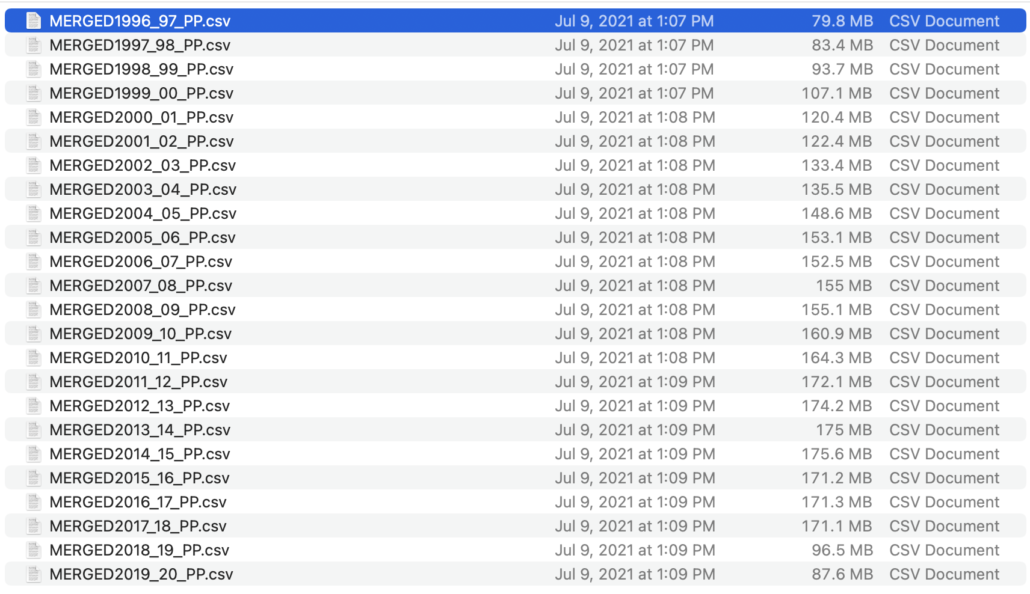
“Institution-level data files for 1996-97 through 2018-19 containing aggregate data for each institution. Includes information on institutional characteristics, enrollment, student aid, costs, and student outcomes.”
government website
Ok … now what?
Step 2 – Learn as much as possible with the data set, turn it into a “project.”
This is where you have to think outside the box. You want to learn skills and tools that Data Engineers use day-to-day right? Then you actually have to use those tools when working with your new data set. What skills you ask? Here.
- setup Docker to run all the code and tech you will write and use.
- write unit tests for the code you write.
- include documentation in a README in your project.
- showcase/learn your coding skill(s) in your programming language of choice.
Basically what you are doing is a small scale project of what could be your future. You want to push yourself to treat it not like a hobby … but as if someone was paying you do this. So do it right.
Step 3 – Embrace the ambiguity and dirty data … that’s real life.
A lot of people will expect some clean data set, something smooth and easy to use. That’s not data in real life, and most likely the open source data set you find and use will not be clean or perfect.
That’s a good thing!
Problem solving skills are key to learning and growing as a data engineer. Your skills in a certain tool or language will only be as good as the challenges you have overcome. If you’re building new skills or trying to show off to prospective employers, it’s the same path. Showing your work that includes overcoming and dealing with problems in the data is a good thing.
Step 4 – Start your example project.
Once you have your open source data picked out, using the link above to find one, you have to come up with an idea. It can be simple, it’s really about the journey more then the destination.
In my case we got the dataset College Score Card data provided by the U.S. government. This includes a number of csv files with information on colleges, their location, things about their students, and cost.
That brings up some obvious questions that we can try to answer as our project.
- How much has the price gone up on the cost of college over the last few years?
- Which States cost the most when it comes to attending college?
Step 5 – Setup a Dockerfile for your project.
For our example project and data, let’s use PySpark, it’s popular these days and most Data Engineers are expected to know it. Docker is a great tool for Data Engineer’s to know, it can be trick at first, but making them is the only way to learn them.
In our case we just need an image wit Python and Spark installed. It will make running our tests later a little easier. The below should do the trick.
FROM ubuntu:18.04

RUN apt-get update && \
    apt-get install -y default-jdk scala wget software-properties-common python3.8 python3-pip curl libpq-dev build-essential libssl-dev libffi-dev python3-dev && \
    apt-get clean

RUN wget https://archive.apache.org/dist/spark/spark-3.0.1/spark-3.0.1-bin-hadoop3.2.tgz && \
    tar xvf spark-3.0.1-bin-hadoop3.2.tgz && \
    mv spark-3.0.1-bin-hadoop3.2/ /usr/local/spark && \
    ln -s /usr/local/spark spark

RUN pip3 install pytest pyspark

WORKDIR app
COPY . /app

ENV PYSPARK_PYTHON=python3
Running docker build --tag=example-project . should build the image for us.
Step 6 – Research the open source data.
In real life when you’re given a project, most likely you won’t know the data … at least not at first. It will require you to sniff around and try to figure out where the data points are that can help answer your question.
In our case we have two questions to answer …
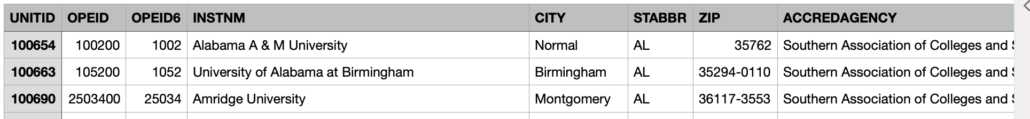
In our case the the open source data we downloaded can with a data.yaml file that gives us column names etc. When we read through it we can find the column that contains the data are looking for. NPT4_PUB contains the “average net price for …. institution.”

Also, when just browsing the files we can see another column we will need, the State … STABBR.
Last but not least we will need a date from which we can pull the year. But it doesn’t exist. We will have to be creative. This isn’t uncommon in real life data projects.
But, if you go back and look at the list of files above …. you can see the date is in the filename. So we will have to use regex to pull the year out. We will deal with this later.
Now we are armed enough to write code.
Step 7 – Write the code.
This is where a lot of the learning and struggle will happen. I know you can read books and take classes, I’ve done both many times myself, and continue to do so. It’s a great way to learn and push yourself. But, nothing can replace the exercise of writing code yourself, code that you have to makeup on your own.
Never forget when you are writing code for yourself, and not for work, do a good job anyways. Make yourself follow the best practices. Write functional, modular, and testable code.
In our example we are going to use PySpark to answer the following questions….
Here it goes…
from pyspark.sql import SparkSession, DataFrame, Window
import pyspark.sql.functions as F


def read_college_date(spark: SparkSession, data_location: str = 'data/*.csv') -> DataFrame:
    df = spark.read.csv(data_location, header='true')
    return df


def add_source_file(df: DataFrame) -> DataFrame:
    df = df.withColumn('source_file', F.input_file_name())
    return df


def select_and_filter(df: DataFrame) -> DataFrame:
    df = df.select('NPT4_PUB', 'STABBR', 'source_file')
    df = df.where(F.col('NPT4_PUB') != 'NULL') # if we don't have cost information, throw it out.
    return df


def pull_year_from_file_name(df: DataFrame) -> DataFrame:
    # pull out the year that can be found in the file name between "MERGED" and "_"
    df = df.withColumn('year',
                       F.substring(F.regexp_extract(F.col('source_file'), 'MERGED(.*)_', 1), 1, 4)
                       )
    return df


def pull_cost_by_year_metrics(df: DataFrame) -> DataFrame:
    results = df.groupby('year').agg(F.avg('NPT4_PUB')).alias('avg_cost')
    results.sort(F.col('year').desc()).show()


def pull_most_expensive_states_for_college(df: DataFrame):
    df = df.filter(F.col('year') == 2019)
    win = Window.partitionBy('STABBR').orderBy(F.col('NPT4_PUB').desc())
    df = df.withColumn('rowNum', F.row_number().over(win))
    df = df.filter(F.col('rowNum') <= 10)
    df = df.groupby('STABBR').agg(F.avg(F.col('NPT4_PUB')).alias('avg_cost'))
    df.sort(F.col('avg_cost').desc()).limit(10).show()


def main():
    spark = SparkSession.builder.appName('HistoricCollegeData') \
        .getOrCreate()

    df = read_college_date(spark=spark)
    df = add_source_file(df)
    df = select_and_filter(df)
    df = pull_year_from_file_name(df)
    pull_cost_by_year_metrics(df)
    pull_most_expensive_states_for_college(df)


# Press the green button in the gutter to run the script.
if __name__ == '__main__':
    main()
Here are the results…
# average cost of college by year
+----+------------------+
|year|     avg(NPT4_PUB)|
+----+------------------+
|2019| 9999.123110151188|
|2018|10009.548455804046|
|2017| 10092.64055055585|
|2016| 9813.659989457037|
|2015| 9726.174869109947|
|2014| 9615.019341348667|
|2013| 9571.201973001038|
|2012| 9296.356589147286|
|2011| 8616.897253306206|
|2010|  8301.22397094431|
|2009| 8399.993471810089|
+----+------------------+

# Top 10 most expensive States to go to school in.
+------+--------+
|STABBR|avg_cost|
+------+--------+
|    NH| 18249.1|
|    VT| 16770.0|
|    DC| 15894.0|
|    SD| 15746.7|
|    DE| 13013.0|
|    MN| 12964.9|
|    RI| 12469.0|
|    AK| 11856.8|
|    ME| 11513.3|
|    CO| 11499.4|
+------+--------+
While I’m not going to talk specifically about the code, I’m going to talk about what a Data Engineer could learn while writing such code.
There are a number of things … here are a few …
- Learn to write clean and testable code.
- Learn how to be creative to get what you need (
pull_year_from_filenamemethod ) - Learn how to translate requirements into code (
pull_cost_by_year_metricsandpull_most_expensive_states_for_college) - Learn more complex functions like
Window.partitionBy('STABBR').orderBy(F.col('NPT4_PUB').desc())andF.substring(F.regexp_extract(F.col('source_file'), 'MERGED(.*)_', 1), 1, 4)
Sure, this might be straight forward code, nothing to fancy, but when you’re new and trying to get practice and learn new things, this type of project and code is perfect, and doable.
Step 7 – Write the unit tests.
Unit tests are something that is not emphasized enough in Data Engineering. Testing is good practice, helps other people and you work on the code quickly without worrying about what you might be breaking. Testing also requires you to think about the method and functions you are testing more, it helps you write better code.
I wrote another blog post about how to unit test PySpark code here.
We will write another file, a docker-compose.yml file that we can use to run our tests inside our previous Docker image.
version: "3.9"
services:
  test:
    image: "example-project"
    volumes:
      - .:/app
    command: python3 -m pytest
And now we unit test our functions.
import pytest
import main
from pyspark.sql import Row


@pytest.mark.usefixtures("spark_session")
def test_read_college_date(spark_session):
    test_df = main.read_college_date(spark_session)
    assert test_df


@pytest.mark.usefixtures("spark_session")
def test_add_source_file(spark_session):
    test_df = main.read_college_date(spark_session)
    test_df = main.add_source_file(test_df)
    assert 'source_file' in test_df.columns


@pytest.mark.usefixtures("spark_session")
def test_select_and_filter(spark_session):
    test_df = spark_session.createDataFrame(
        [('10000', 'IA', 'test.file'), ('NULL', 'IA', 'test.file')],
        ['NPT4_PUB', 'STABBR', 'source_file']
    )
    test_df = main.select_and_filter(test_df)
    assert test_df.count() == 1


@pytest.mark.usefixtures("spark_session")
def test_pull_year_from_file_name(spark_session):
    test_df = spark_session.createDataFrame(
        [('10000', 'IA', 'MERGED2019_')],
        ['NPT4_PUB', 'STABBR', 'source_file']
    )

    test_df = main.pull_year_from_file_name(test_df)
    assert test_df.select('year').collect() == [Row(year='2019')]
Results …
test_1  | ============================= test session starts ==============================
test_1  | platform linux -- Python 3.6.9, pytest-6.2.4, py-1.10.0, pluggy-0.13.1
test_1  | rootdir: /app
test_1  | collected 4 items
test_1  |
test_1  | test_main.py ....                                                        [100%]
test_1  |
test_1  | ============================== 4 passed in 5.35s ===============================
Not bad for just a little free open source data project?
Musings
I just wanted to show how it’s possible for someone looking to get into Data Engineering, or build some of the skills they currently have. The link shown above has more then enough open source data sets, enough to keep someone busy for a few years.
Once you’ve got data in hand, it isn’t that hard to make up a few questions to answer, and that’s when the fun and learning starts.
You can see above, based on the minimal work we did what could be learned.
Research, Docker, Spark, Unit Testing, being creative with regex, trying more complex analytics using Window functions. Really the sky’s the limit, the harder you make it on yourself, the more you will learn.